
エネルギー消費量と二酸化炭素排出量の継続的な増加
「世界エネルギー動向」最新版をご覧ください。これは、初めて公開された2024年度版のエネルギーと二酸化炭素排出量に関する統計を基に、当社独自のデータベースを活用して専門家が編纂した分析資料です。
今年、当社のシニアアナリストは、この調査結果を長期的な気候目標に照らし合わせて考察しました。
- 気候変動の緩和に大きく貢献している地域とは?
- 2050年目標の達成に向けて、さらなる努力が求められる地域とは?
- ヨーロッパがパリ協定の目標達成に苦戦している根本的な要因とは?
本レポートは、当社のエネルギーインテリジェンス&データプラットフォームが提供する複数のサービス(例:EnerMonthly)を活用しています。
エネルギー情勢の月次動向をご覧ください:
- 2024年と2025年の連結データシリーズ - 各国のベンチマークと前年比:
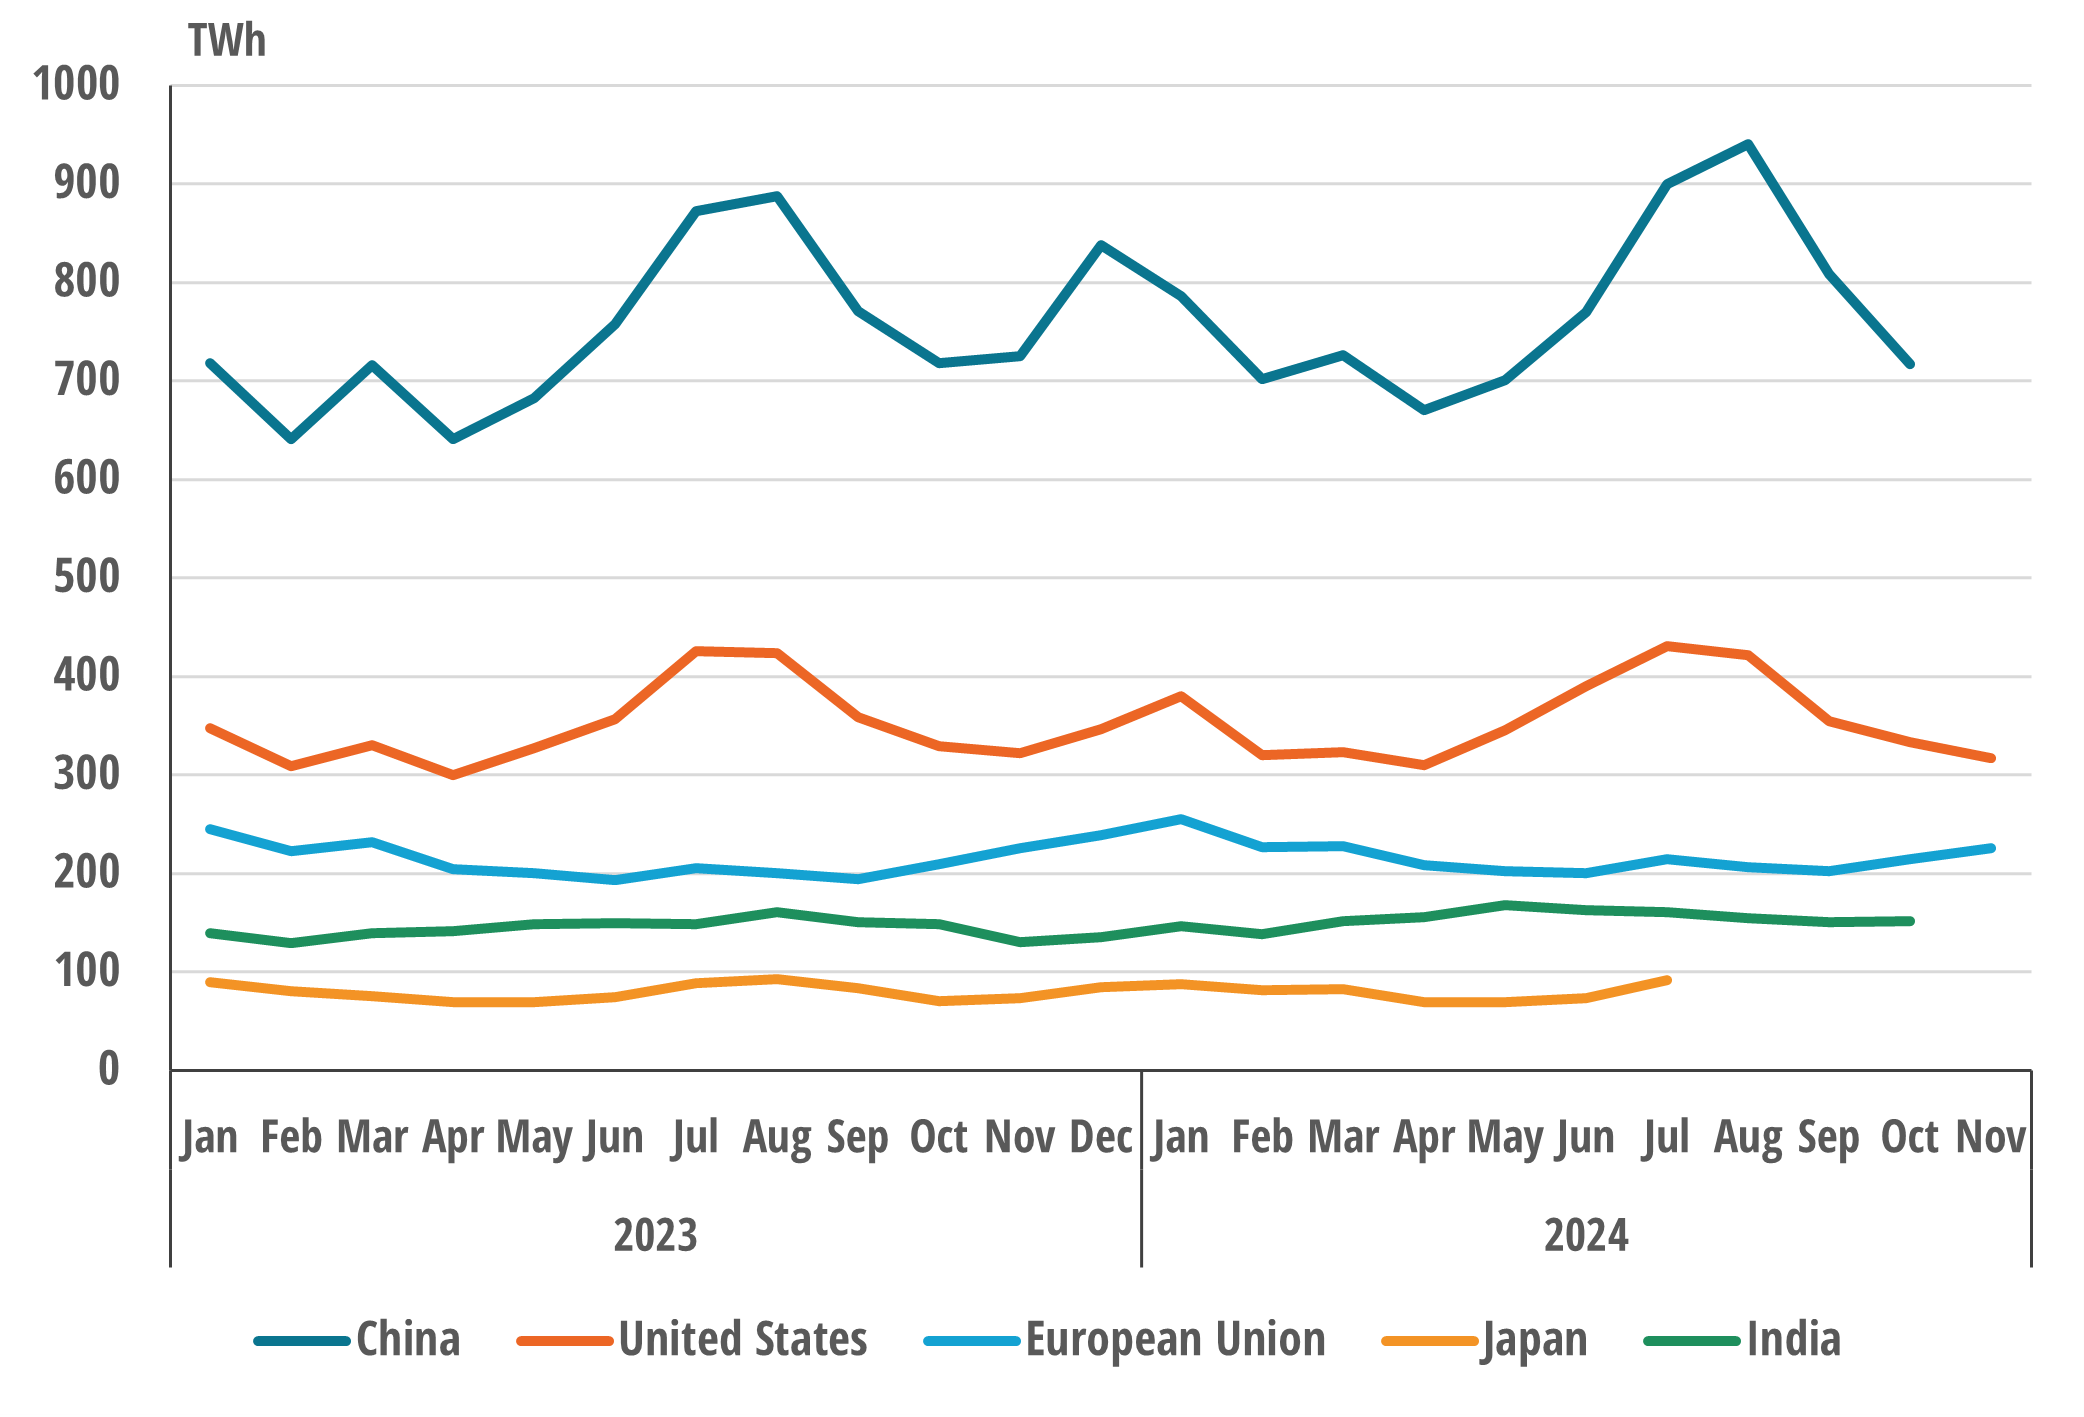
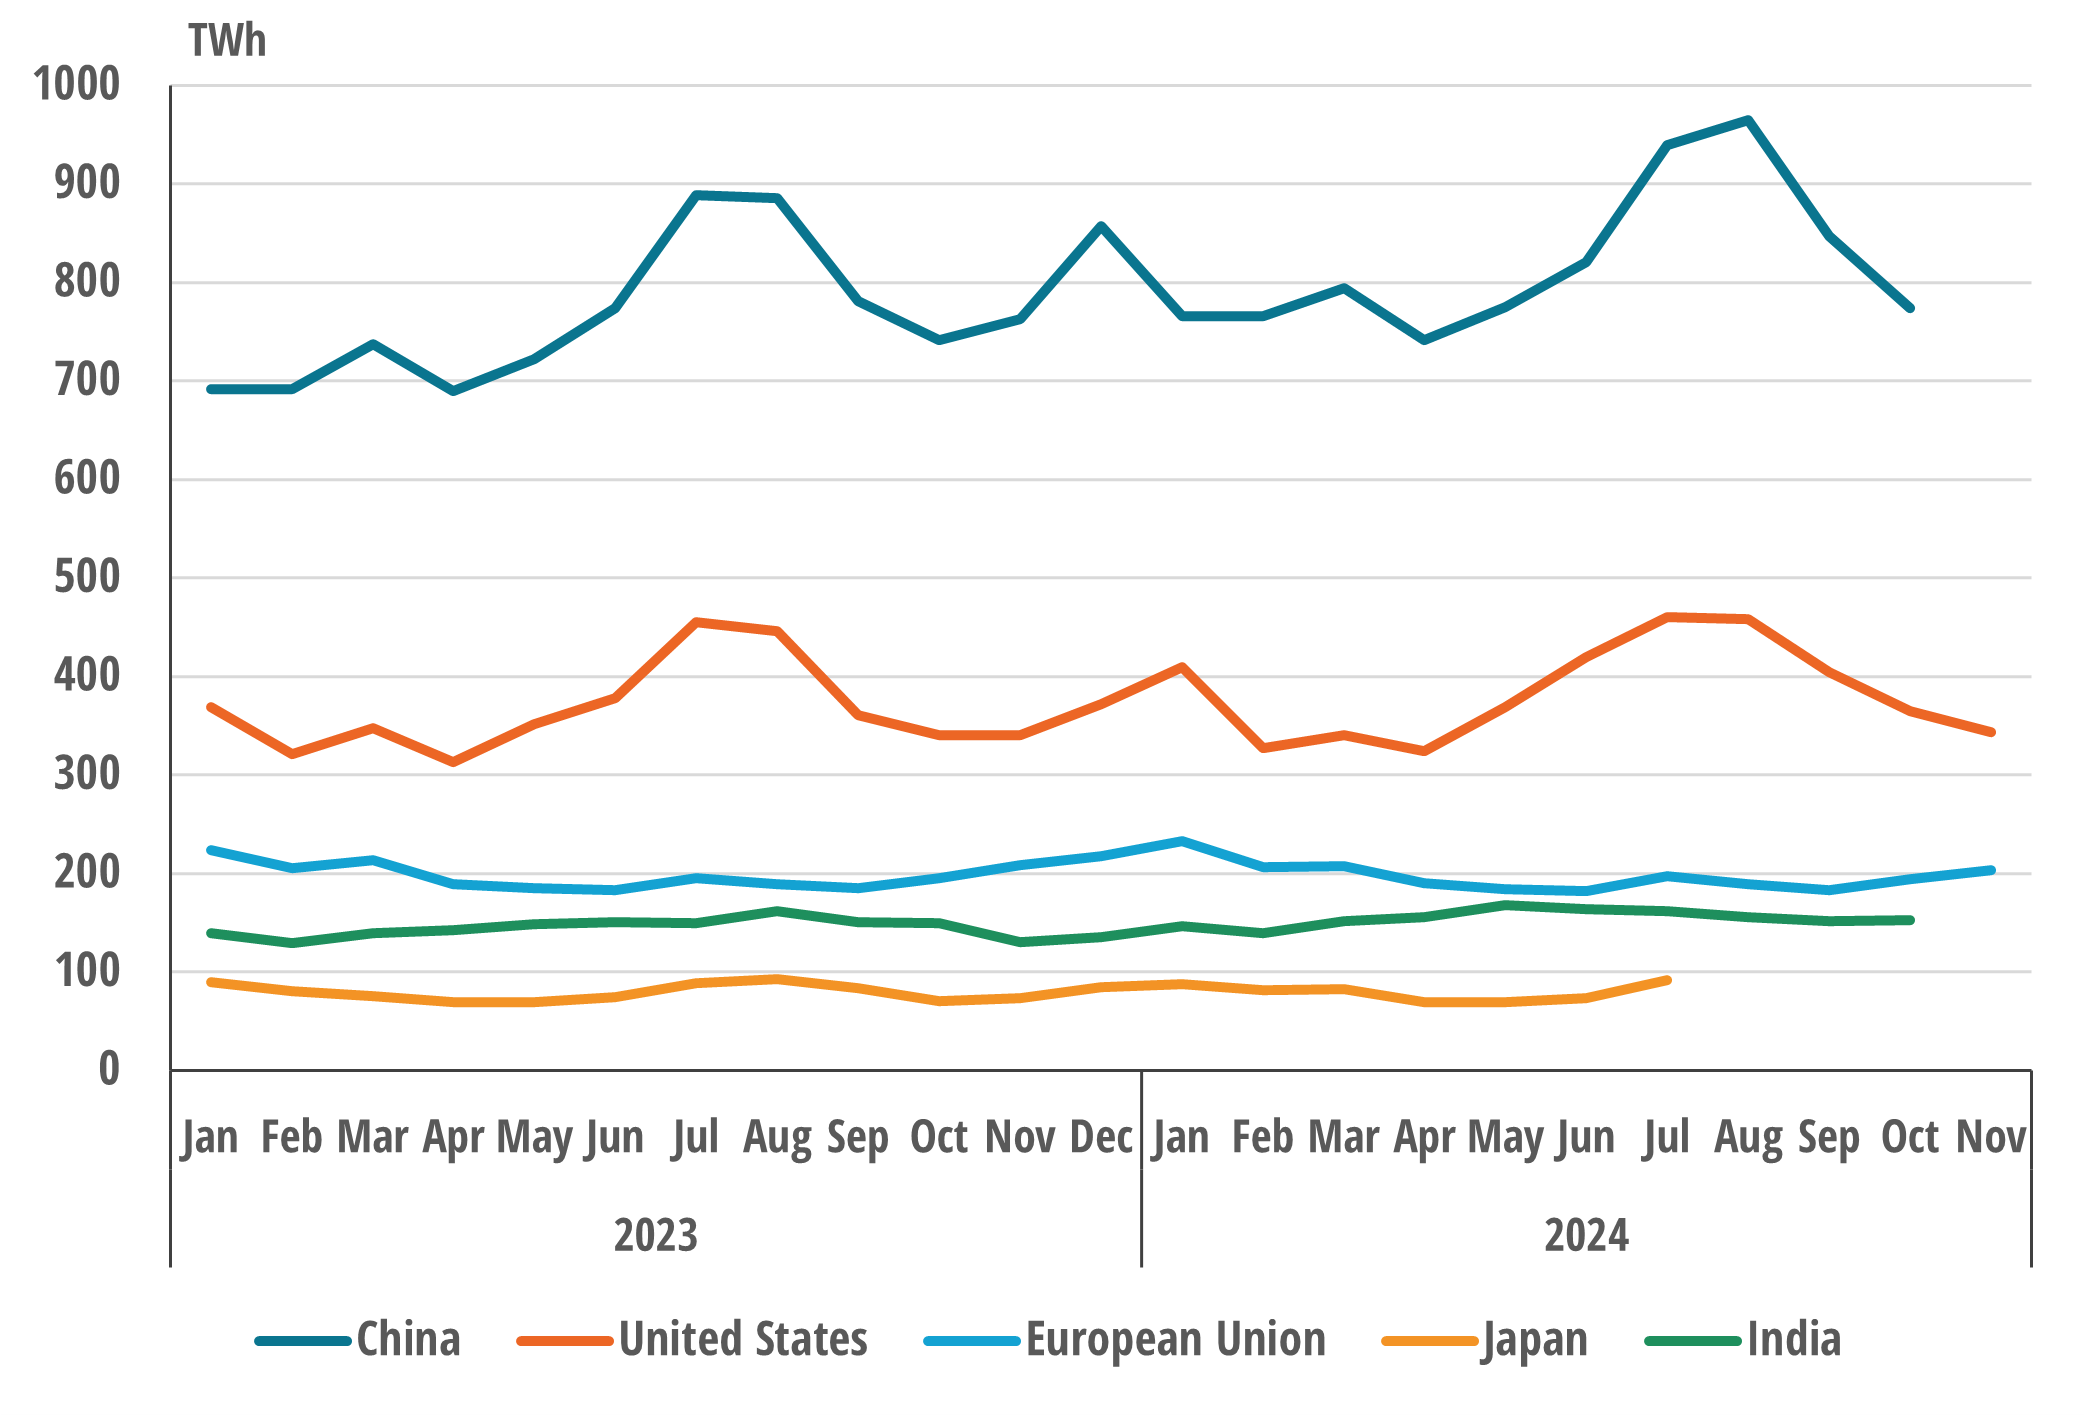
*電力スナップショット:生産量と純消費量
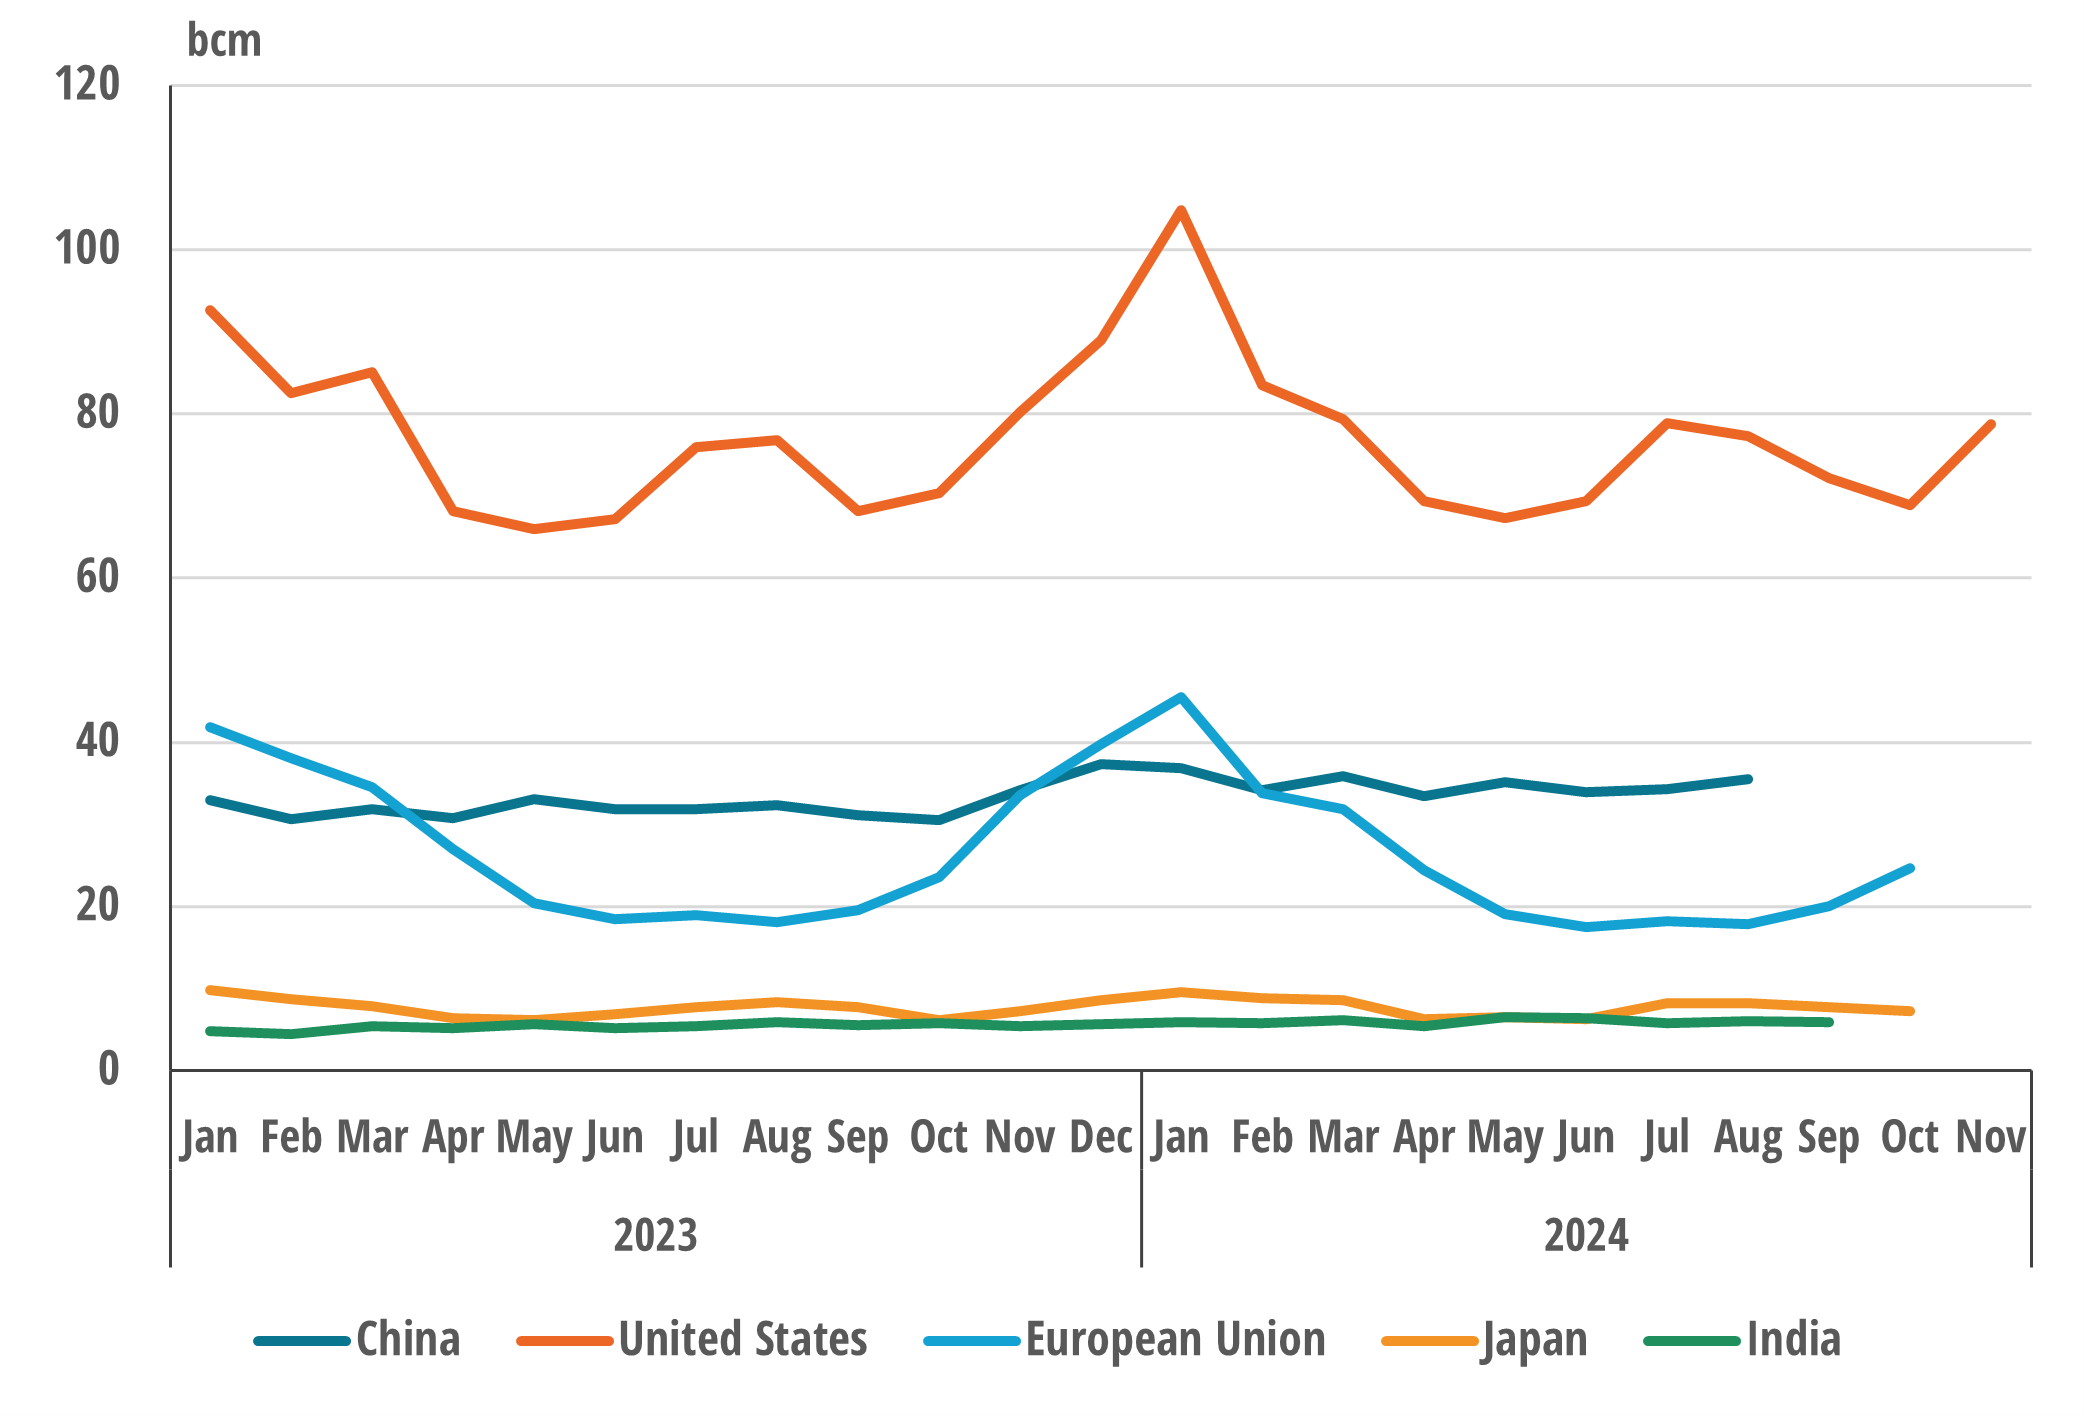
*供給源別一次エネルギー消費:石炭、石油、天然ガス
- カバー範囲: 中国、米国、EU、インド、日本
出典 Enerdata、EnerMonthlyデータベース」
出典 Enerdata、EnerMonthlyデータベース」
出典 Enerdata、EnerMonthlyデータベース」
出典 Enerdata、EnerMonthlyデータベース」
報告書からの抜粋:
2023年 VS 2024年 G20諸国の主要エネルギー・気候数値の比較
G20諸国は、世界のエネルギー消費の80%を占めています。
オレンジの数字:2023年のデータ
青字は2022年のデータ
重要なポイント:
世界のエネルギー消費は、特に石炭とガスの使用量が増加したことで、危機以前よりも急速な増加傾向にあります。G20諸国のエネルギーミックスにおいて依然として大きな割合を占めているのが化石燃料です。特に中国、インド、インドネシアなどのOECD非加盟国では、石炭の消費量が増加しています。米国とロシアでも、ガスの消費量が回復傾向にあります。一方、2024年は石油の消費量が2023年の増加傾向から一転してわずかに減少しました。これは、中国と米国における電気自動車やブラジルでのバイオ燃料など、代替輸送燃料の普及拡大によるものとされています。
中国、インド、インドネシアを中心としたOECD非加盟国、そして消費が安定しているか、減少傾向にあるOECD加盟国(特にEU)との間で、エネルギー消費動向の格差は明らかに広がっています。
こうした傾向にもかかわらず、再生可能エネルギー発電は急速な拡大を続け、発電設備の設置数は過去最高水準を達成しています。この中で重要な役割を果たしているのが中国で、2024年に太陽光発電で278GW、風力発電で80GWの発電量を追加し、それぞれG20諸国における追加設置の69%と76%を占めています。2024年末までに、中国はG20諸国における風力発電所と太陽光発電所の総設置容量の半分を占めることになりました。こうした急成長により、風力発電は8%増加し、G20諸国のエネルギーミックスの9%を占める一方で、太陽発電は29%に急増し、エネルギーミックスの7%を占めている状態となっています。
G20諸国全体のエネルギー消費量の増加率(年率%)

根源: Enerdata, Global Energy & CO2 Data
2024年のエネルギー消費量は2%増加し、2010年から2019年までの期間よりも速いペースで増加しています。‑OECD非加盟国、特に中国(+4%)、インド(+5%)、インドネシア(+6)では、急速な拡大を示しています。2024年、成長が鈍化したにもかかわらず、中国はG20諸国のエネルギー消費量の35%を占め、米国の2倍のエネルギーを消費しました。
最近の動向と脱炭素化のプロセスを比較
重要なポイント:
現在のエネルギー消費量は、エネルギー危機発生以前よりも速いペースで増加しています。GDPとエネルギー消費量、およびエネルギー消費量と二酸化炭素排出量の間には、顕著な乖離は見られません。年々、世界はパリ協定の目標と一致した道のりからますます遠ざかっています。
G20の地域間では動向が著しく異なります。新興国ではエネルギー消費量と二酸化炭素排出量が増加する一方で、先進国では比較的安定しています。ただし、この乖離は主に経済的要因と人口動態要因によるものです。
再生可能エネルギー源は拡大を続けているものの、その成長率は依然として不十分であり、最終用途の電化率は依然として極めて低い水準に留まっています。その結果、化石燃料の消費量は引き続き増加しています。
欧州連合における最近のエネルギー消費と排出量の要因
重要なポイント:
最近、EUにおいては二酸化炭素排出量が減少していますが、その背景には緩やかな経済成長と人口動態の成長があります。この傾向は、特に2022年以降顕著になった欧州の産業活動の減少によって裏付けられています。特に注目すべきなのは、人口増加やエネルギーへのアクセス改善はエネルギー消費の要因ではない点で、これは新興経済国とは対照的です。
二酸化炭素排出量が少なく、エネルギー効率の高いテクノロジーが登場しているものの、その導入率は依然として不十分な状態です。発電部門では大幅な脱炭素化が進んでいますが、最終用途の電気化が広範に進まない限り、その全体的な影響は限定的です。電気自動車とヒートポンプは、その潜在的な可能性にもかかわらず、未だにニッチなテクノロジーであり、導入が鈍化する兆候が見え始めています。
さらに、主に高騰するエネルギーコストへの対応策として、家庭におけるエネルギー自給率が向上するなど、ポジティブな行動の変化が認められます。また、旅客輸送量は新型コロナウイルス発生以前と比較しても低い状態が続いています。
EUの発電所*における二酸化炭素排出量の内訳
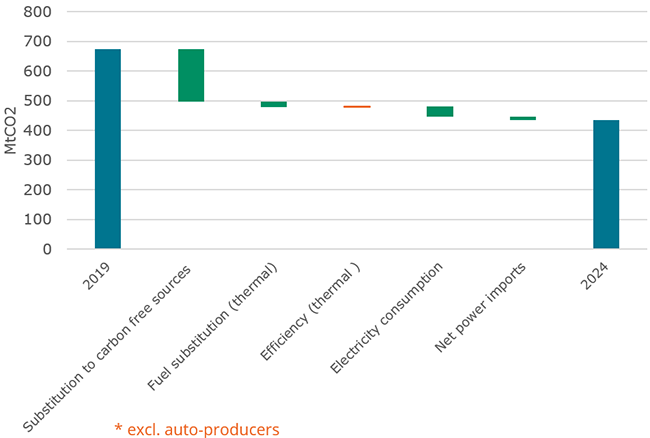
Source: Odyssee, Enerdata
EUにおける産業活動は、2022年以降5%減少しています。この傾向はエネルギー集約型産業で特に顕著で、さまざまな部門のエネルギー消費量を考慮すると、7%の削減が見られました。この傾向は、主に産業部門におけるエネルギー消費量と二酸化炭素排出量の減少の背景となるものです。さらに、2015年以降、全体の電力消費量は減少しており、総エネルギー消費量に占める電力の割合はわずかに増加したに過ぎません。